Why care about differentiating axial from refractive ametropia?
Refractive error (ametropia thereafter) arises from a mismatch between axial length (AL) and the equivalent power of the refractive components of the eye, i.e. cornea, crystalline lens. Such mismatch is often (predominantly) axial in nature. AL is typically high (>24mm as a fairly useful rule of thumb) in myopes. Importantly, axial elongation is mainly attributable to changes in vitreous chamber depth. This explains why myopia is associated with clinical features in the posterior segment of the eye, e.g. peripapillary atrophy (PPA), tesselation.
In trying to elucidate what a deep learning (DL) model such as Varadarajan’s looks at when predicting refractive error (regression task) from fundus images, I’m drawn to think that a large part of the model is really just predicting the axial component of ametropia. This is based on the understanding that:
- Variation in corneal and lenticular features is hardly reflected in a fundus image.
- Retinal features that could possibly hold information about ametropia are mostly axial in nature.
Regarding (2), these retinal features does not necessarily have to be biologically meaningful, i.e. retinal thinning, PPA, etc., but they can also be related to the complex interactions between the camera system and the optics peculiar to the eye. One prominent example of the latter is the variation in fundus magnification across different levels of ametropia, which I will focus on in another post. For now, it is suffice to say that:
the main source of variation in fundus magnification is variation in AL rather than cornea/ lens curvature.
Taken together, we can hypothesise that:
DL should at least be as good at predicting AL from fundus images as it is at predictng ametropia.
By extension, this also implies that:
A DL model has more difficulty predicting that part of ametropia arising from cornea/lens than that coming from AL.
I shall explore how the last hypothesis can be tested below. If the null hypothesis is to be rejected, then a lack of information pertaining to corneal/ lens curvature in retinal images could have some negative impact on a model’s regression performance. One would, therefore, naturally hope that the axial ametropia that we so often speak of is purely axial, i.e. like a Gullstrand’s schematic eye with axial ametropia where the equivalent power of the eye is fixed at +58.60D, and the only variable is AL.
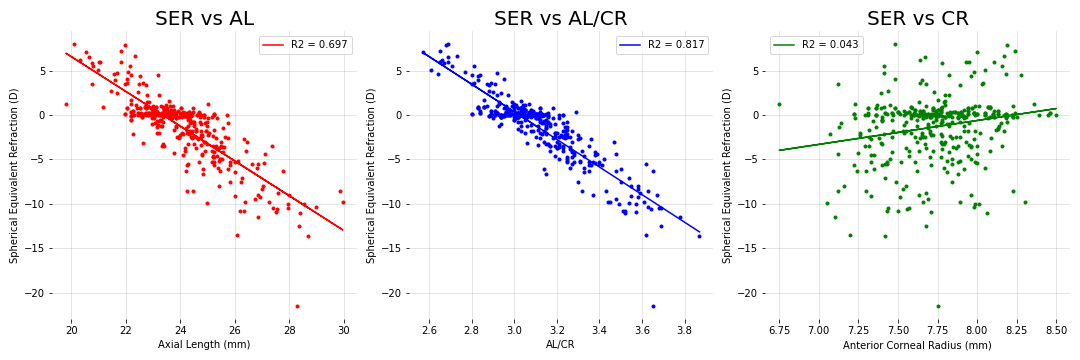
But real-world data suggest otherwise. We get a fuller picture of an eye’s refractive state with the addition of anterior corneal radius (CR). When modelled with a simple linear regression, AL alone does not explain the observed variance in spherical equivalent refraction (SER) to a very high degree. Published studies have reported values of 0.580 and 0.432. When anterior CR is considered alongside AL, i.e. AL/CR, the observed variance in SER increases considerably to 0.837 and 0.658, respectively.
This is corroborated by an unpublished dataset that I am playing with (412 instances; unknown age but likely to be university students). increases from 0.697 with AL to 0.817 with AL/CR (see Figure 1). Older age could partly explain why our
is higher, since compensatory lens/ corneal changes are more likely to be seen in younger children (in the two studies above, age ≤ 12y/o) than adults.
Figure 1
Coefficient of determination is higher with AL/CR.

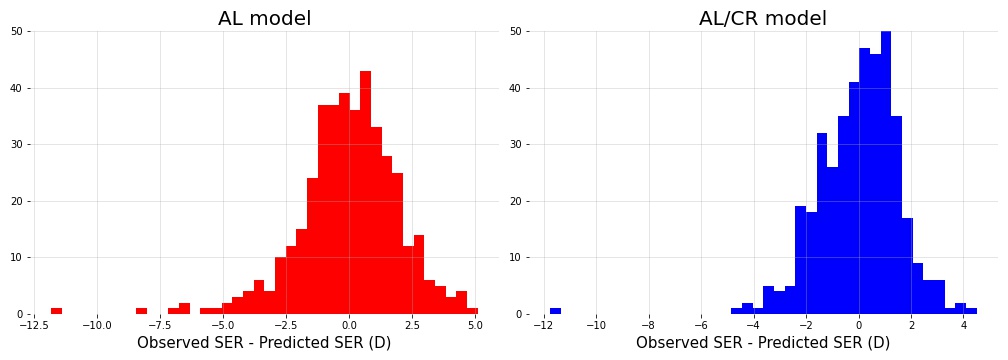
As seen in Figure 2, the distribution of residuals is negatively skewed when we only consider AL (left), indicating that some (meaningful) variation in SER is left unaccounted for by the model. Indeed, the distribution is more gaussian-like with the addition of anterior CR (right). This is not surprising, given that anterior CR contributes the most to the equivalent power of the eye and is often implicated in refractive ametropia1.
If we disregard the single outlier (right histogram; residual ~ -12D), the distribution of the residuals does resemble a normal distribution (not perfect but much better than before). These residuals can therefore be seen as random noise associated with normal variation in parameters such as the refractive indices of cornea, aqueous humour, lens and vitreous humour. They do not have as much value as AL and anterior CR in explaining the variation in SER among individuals.
Figure 2:
Distribution of residuals becomes more gaussian-like with the addition of anterior CR.

This naturally leads one to wonder:
Can we further improve DL performance with the addition of anterior CR?
A simple approach to test the hypothesis the axial component of ametropia can be predicted more easily
Looking at the AL model (left) in Figure 2, we see that the majority of absolute residuals are no greater than 1D (55.4% of all instances to be precise). The threshold is of course somewhat arbitrary, but we may treat these instances as ametropia that can be largely explained by AL. Conversely, the remaining instances with residuals greater than 1D can be treated as ametropia with a significant refractive component (i.e. significant enough to affect model performance). If the hypothesis is right, a model should yield better performance (MAE) when trained and tested on the former dataset than the latter.
-
2/3 of the equivalent power of the Gullstrand’s schematic eye comes from the cornea, with the remaining coming from the lens. Recall that
; the difference in refractive index is largest between the air (n=1) and cornea (n=1.376), making anterior CR the largest determinant of corneal equivalent power. Light emerging from posterior cornea experiences little change in refractive index (cornea n=1.376 - aqueous n=1.336); thus, posterior CR contributes little to corneal equivalent power. Likewise, there is relatively little variation in refractive index between aqueous n=1.336), lens (for the sake of simplicity, assume homogeneous Gullstrand-Emsley lens with a constant n=1.416) and vitreous (n=1.336). Hence, variation in (anterior or posterior) lens curvature does not have as big of an impact on refractive status as anterior CR. ↩